Models come in many forms, but basically they are quantitative summaries of how people believe nature works. They are the vessels that scientists pour their knowledge in to. Models play a central role in nearly all forecasting (and for a good chunk of scientific research as well) so it seems that a discussion of them here is inevitable.
The classic analogy for hydrology models is that soils hold and release water like a series of leaky buckets. But instead, let's start by discussing how to model a cafeteria/mess hall/canteen for hungry meditating monks.
During my 10 days of silent meditation, the meals were a highlight and I looked forward to going to the cafeteria each day. When all you have to do for hours on end is concentrate on the breath whistling past your nostrils, you can entertain yourself by conjuring back-stories for that hairline crack in the wall. Lets just say I had a lot of time to ponder the how the cafeteria worked. I am also convinced that two different people painted the cafeteria's walls, one Swiss, the other a drunk.
 |
| A typical lunch at Vipassana. The food was quite good, really. Day 6's tofu dish still gives me cravings and attachment. |
 |
| The eating area for females in the meditation center |
 |
| Major processes in the cafeteria |
What might be a good model for serving? Maybe monks can get their dishes and utensils and work their way through the serving line at the rate of about 5 monks per minute. If 25 monks queued up at once, it would take 5 minutes before the line was empty again. The rate people are served does not really depend on how many people are in line.
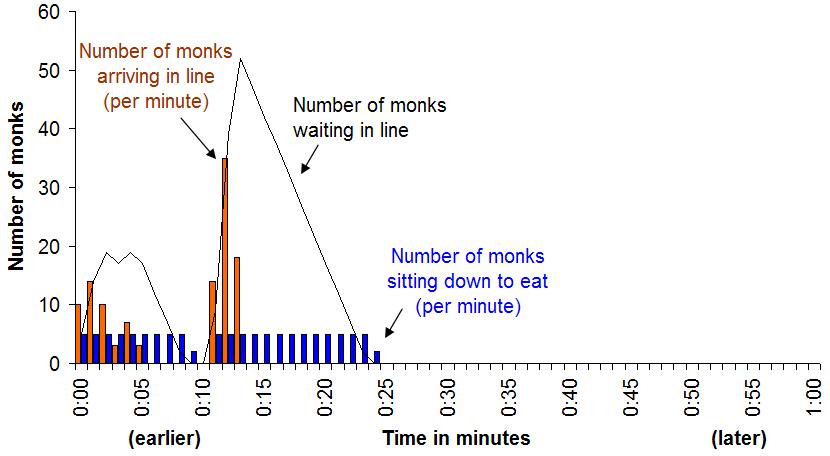 |
| Oh yes. I really did spreadsheet this up. Here is the chart of monks going in (orange) and out (blue) of the serving line versus time. Here the monks arrive in two bunches, one at the start of the hour, and one about 10 minutes later. The black line shows how many monks are waiting to be served. Monks are served at a rate of about 5 per minute. 25 minutes into the lunch service all the monks are now seated and eating. |
 |
| How long it takes monks to eat meals. Some are slower eaters (right side) some are faster (left side) but most people are somewhere in the middle. |
 |
| Putting it all together. In this case, monks arrive at the cafeteria (brown) in two bunches. The first monks start finishing about 10-20 minutes later. The rate that monks leave the cafeteria is shown in green-blue. Substitute "monks arriving" with "precipitation falling" and "monks finishing" with "river flowing" and you're looking at the kind of charts that many hydrologists deal with all the time (called hyetographs and hydrographs). |
So where does it all fall down? Why are there dozens upon dozens of different models out there? And why are they such a challenge to use for real-world forecasting?
[Tune in to part 2!]
[Tune in to part 2!]
No comments:
Post a Comment