When not having Information Overload, I suffer from Information Guilt. I feel guilty that there is so much information out there that I haven't read. Considering that I'm homeless while traveling for a year, it seems completely irrational to have tossed out my extra pairs of socks because they were too heavy, yet I still carry around a sheaf of scientific journal articles and a few kilograms of paperbacks.
When I left Australia, I picked Henry Miller's 650 page Plexus as my leisure reading because the version I found was in nano-squint font. I didn't realize when I picked it that that book is about someone with a standard 9 to 5 job that gets fed up with it and decides to cut loose, quit his job, travel and be a living artist. Miller didn't start his own blog, but remember these were different times back then. It's taken months to realize that because it kept falling down to the bottom of my queue.
My brother has helped fueled my addiction by gifting me his collection of Great Courses, most of which are on DVDs. Each course has probably around 20 1-hour lectures. There are 50 courses I could picture myself doing (I might skip ones like a review of the Roman Moralists). In all, it's about 1000 hours of listening, or around 2 years of a daily commute.
This doesn't even get into everything out on the Internet. Trying to keep up with existing blogs is like trying to drink out of a firehose. I am most impressed by climate scientists with real jobs that somehow manage to bang out at least one new insightful post a day.
Well, to add to your own case of Information Guilt, I've added a blogroll of what I currently read and find useful. They are updated by who has the most recent material at the top. To find it, scroll down and to the right on the main page.
Have I forgotten anything? Put a message in the comments. Thanks, Tom
Tuesday, January 31, 2012
Hydrologic Oddities: Where Two Rivers Become a Creek

Bureau of Meteorology forecaster Chris Leahy told me about an interesting hydrologic oddity in Australia. Cooper's Creek is the only place where "Two rivers meet to form a creek." Wikipedia describes Cooper's Creek as "One of the most famous, yet least visited rivers in Australia".
 |
| A map of Australia's outback rivers |
When he discovered it in a dry year, misguided explorer Charles Sturt named it 'Cooper's' after Charles Cooper (then [South Australia's] Chief Justice) and 'Creek' because he didn't think anything that small was actually a river!
 |
| Scott Bridle's aerial photo of flood patterns. His website has many more good photos of Australian landscapes taken from above. |
Often the interior of Australia is completely dry and there is no surface flow. But when it flows, it flows everywhere. There is not so much a river channel as there is the "channel lands".
 |
| A satellite image of where the rivers come together to form a "creek" |
There's many words for water flowing in channels and there's no standard definitions. Here are some of the ones I have known, roughly from my notion of largest to smallest:
River
Stream
Run
CreekBrook
Rivulet
Wash...
Wash...
There's similar debates about how to describe the land surface area that drains into a channel.
Basin
Watershed
Catchment
Area
Drainage
Hillslope
Many people also use sub-catchment, sub-area and so on, adding another layer of complexity (e.g. which is bigger, a sub-watershed or catchment?)
My rule of thumb when living in Arizona was that a river was anything you couldn't jump across. I learned this by unsuccessfully trying to jump across the Gila River.
Wednesday, January 25, 2012
Under the Sea (Part 2)
In celebration of the 100th post, yesterday I included some of the animals that I have seen while traveling.
There have been occasions where things have come out of the water to us. An earlier post talks about our experience with flooding in the Philippines. When I went down to the Marikina River and saw the statue commemorating the flood disaster (that itself was under water around the time of its unveiling a few days before), I found this fish on the ground. It is a Janitor Fish (Armored Catfish), an invasive species that can live in heavy pollution. It was washed up onto the sidewalk because of the floods.

So, here is part two of things that lived under water. We’ll get back to river forecasting in a bit…
We last left off in Sipadan, northeast Borneo. Sipadan is where I developed an infatuation with sharks.

At first I thought Gray Reef Sharks were “Gravy” Sharks because of our guide’s accent. Most sharks quickly swim away from humans, but in Sipadan I was able to quietly and slowly land a meter from one resting on the bottom. I looked at him and he looked at me for fully three or four minutes, which is an eternity when diving.
I try not to anthropomorphize, but I sensed I was dealing with a sentient and intelligent being. It was unlike anything else I had experienced in my 150 or so dives. Later that night we saw a presentation about the science and lives of sharks. I also try to keep my politics off the blog, but the rate that sharks are disappearing (70 million per year) is horrific. They have gotten very unfair press as killers. Even Peter Benchley, the author of “Jaws”, regretted portraying sharks as dangerous and later became a shark conservationist. One of the main concerns of conservationists is to ban shark finning (cutting off the fins for soup and traditional medicine). Of course, like any environmental issue there are vocal interests on both sides.
After Sipadan we went to Malapascua Island in the Philippines to go look for Thresher Sharks, the kind with the very long tail.

Then we went to Sri Lanka and saw a pod of Blue Whales that don’t migrate. They are very hard to photograph but their tail looks just as you would imagine a whale tail to look:

After that was the Maldives where we saw Manta Rays…

as well as Whale Sharks, the largest existing fish species. Here are two shots from our diving partner Toby (the other Maldives pictures below are from other diving partners).
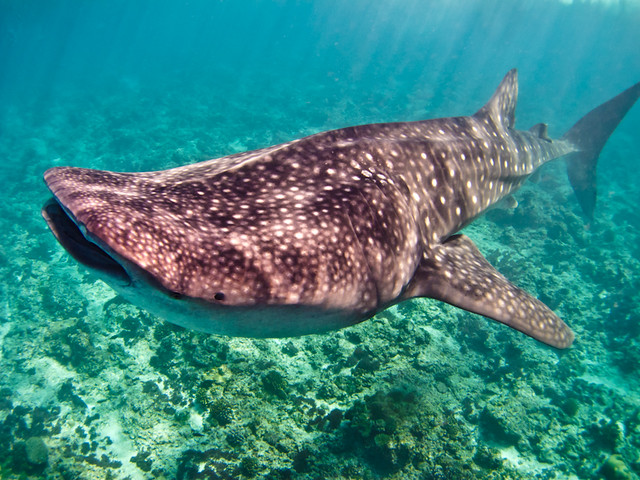
Person shown for scale in the upper left of the next picture:

There were more Stingrays than you could swing a stick at (not that you would want to)…

and then came the strangest thing we have seen underwater. Two Leopard Sharks (each about 3 meters long) were laying on the bottom. One was on her back and the other was gently nibbling on her tail. We think they were getting frisky.

In the Maldives we also discovered what Remora are. Note the flat ridged head.

When we dove in, a school of them followed us and were very curious. Kitty wandered off from the group but then we heard an underwater scream. She was flailing and punching as they attacked her. We signalled to her to calm down and not panic but then suddenly one of them nipped at my legs. When I swatted it away, the group darted in my direction and swarmed me as well. They get excited and are attracted to underwater motion.

Eventually we figured out that these are cleaner fish that attach themselves to sharks using those suction cups on their heads. They just thought we were dirty so they clamped onto our tanks and wetsuits. Kitty had marks on her arm for weeks and they remain the “one thing in the sea she is afraid of”.

For how much I have tried to understand rivers, I am completely humbled by the ocean. Hydrology is difficult because it is hard to see what is happening underground. Similarly, it is often said that scientists know more about the moon than the bottom of the ocean. This article shows just how few measurements are taken in the ocean (it also includes nearly artistic quality maps of where all the gaps in data are).
A friend of mine had a saying “The ocean is much deeper than the grave.” I take it to mean that if you ever feel that there is nothing more to life, nothing new worth doing, learning, or exploring, if your life feels small then consider the enormity and mystery of the ocean…. You still have a long way to go and many things to see along the way.
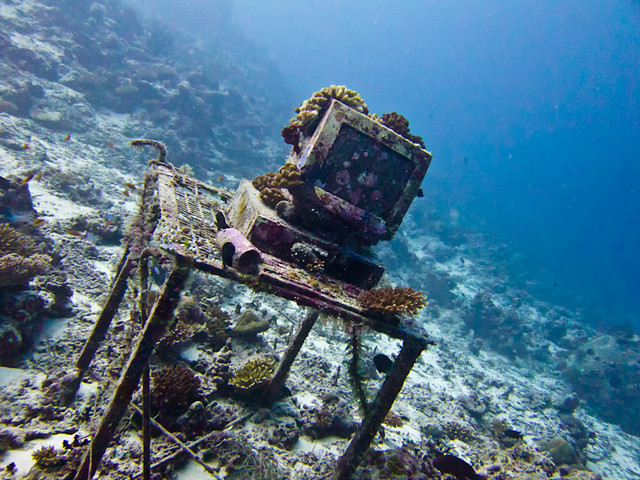
If you feel the need to have a desk, you can always try this underwater workstation we saw in the Maldives (thanks again Toby!)
100 Posts: Under the Sea (Part 1)
Earlier this week was the 100th post! It is hard to believe that it has been 10 months of writing and the blog has 59,000 words on it (the average book is 80,000).
All this done with 5 months of full-time traveling to 9 countries, including hobbling around Southeast Asia on crutches for about a month. I chipped a tooth, lost 10 pounds and nearly had my ear bitten by a monkey. Never say I don't try hard to bring you the best in hydrologic entertainment!

(Seconds after this photo was taken, this little guy tried to peel my head like an orange)
Usually this is the point where I would reminiscence of funny memories (e.g. we thought getting four people in a motorbike-taxi was impressive until we saw five)...
Or remember strange quotes (e.g. "The guide said that our safety plan is: If lava comes flying at you, run away… run backwards, however, so you can dodge the lava as it comes at you")…
Or advice I would give me a year ago (e.g. “Without local contacts, you have nothing")…
But compared to a year ago, the thing that is most different now is the sheer number of wild animal encounters we’ve had. CSIRO’s site in Highett doubled as a nature preserve so I would occasionally see something trot by the office or fly into my window, but it is hard to get out into the world with a desk job.
So, part 1 – Sea Monsters… Let’s go!

Where I’ve used a photo from the web, I’ve put a link, otherwise the photos are from dives we’ve gone on.
Our first diving spot was in Sulawesi, Indonesia (Bunaken Island and Lembeh Strait). The area is famous for “macro” photography, i.e. small things that are usually camouflaged.
This includes things such as tiny Frog Fish…

…Pygmy Seahorses (this one is probably about the size of your thumbnail)…

…and one of my favorites, Flamboyant Cuttlefish. They are best appreciated in video because their neon bodies flash and the patterns swirl.

We saw Mandarin Fish mating. They are about 5 cm long and only come out at night. When they mate, one saddles up next to the other and then they swim vertically for about half a meter, wiggling side-by-side.

There were Moray Eels of all shapes and sizes everywhere we’ve gone.

In Sandakan, Malaysia we went to a Giant Sea Turtle hatchery. Sea turtles are like the dopey-eyed Golden Retrievers of the ocean.

At night you can watch a meter-wide turtle crawl up the beach, dig a hole and drop eggs in the sand. The eggs are collected and put in a nursery. About a hundred 2-cm long hatchlings come out of each hole, are collected in a grocery basket, and set loose on the beach. Nearly all of them are promptly eaten by predators. What the surviving hatchlings do for the next ten years (called “the lost years”) is almost totally unknown to scientists, but then they return to lay eggs again.
It was very interesting to hear how little we know about sea turtles, that for most of their life in the ocean we have very little idea of what they are up to. It seems common that science education displays try to arm visitors with a litany of facts about what is known (e.g. “Sea turtles can live hundreds of years”). Very rarely have I seen discussion about how we know what we know. How would you know a turtle was 200 years old? Ask it? It is most important to show what we don’t know and why, to build support for future research and monitoring.

After Turtle Island we went to Sipadan, Malaysia off the east coast of Borneo. Sipadan has unparalleled diversity and abundance of life, in partly because access to it is so tightly controlled. Jacques Cousteau said “I have seen other places like Sipadan, 45 years ago, but now no more. Now we have found an untouched piece of art.”
Sipadan is probably most famous for its “tornadoes” of jack fish and barracuda. This photo is from Layang-Layang which is nearby, but gives an idea of what a jackfish tornado looks like. If you swim into one, all you can see is fish, it is almost hypnotic.

Kitty was lucky enough to see Hammerhead Sharks, which are exceptionally rare, i.e. other people exclaimed “I’ve been coming here for 10 years and have never seen one before”. They are also very shy. This was as close as I got to one (the viewfinder on the left).

We don’t take underwater photos ourselves, but Sipadan divers are serious about their equipment. This Japanese lady’s equipment was about as big as she was.

Tomorrow there will be more mysteries from down below…
Saturday, January 21, 2012
Making Forecasts of the Forecasts
There is a good article by AJ Jain on his blog about hydrology as an alternative profession for meteorologists. He is a meteorologist working in the energy trading markets. River flow has an impact on hydropower generation and this, in turn, has impacts on natural gas and other sectors. From his post
Depending on the region and time of year, hydropower can have a small or large influence on market prices. High impact seasons on market prices would be Winter and Spring…low impact seasons would be late Summer/mid-Fall. And hydrologists would not only model, analyze and gather this information, but they would communicate it to traders as soon as new fundamentals are released.
Because the hydro system can be complex (due to many variables affecting the stream flow forecast), your communication skills need to be strong too. In the NW, hydro forecasts can sometimes be as important (if not more important) than the weather itself for west power traders.
I do recommend subscribing to AJ's blog, especially for anyone considering a career in forecasting. He has an insider's perspective and gives practical advice.
Depending on the region and time of year, hydropower can have a small or large influence on market prices. High impact seasons on market prices would be Winter and Spring…low impact seasons would be late Summer/mid-Fall. And hydrologists would not only model, analyze and gather this information, but they would communicate it to traders as soon as new fundamentals are released.
Because the hydro system can be complex (due to many variables affecting the stream flow forecast), your communication skills need to be strong too. In the NW, hydro forecasts can sometimes be as important (if not more important) than the weather itself for west power traders.
Although I was never directly involved with the Northwest US energy markets, I knew some people who worked at 3Tier, one of the private forecasting companies mentioned, and the Bonneville Power Administration, a quasi-government utility that had an in-house forecasting unit. From what I was told, given that the government provides forecasts for free, the advantage that the private companies offered was "forecasts of the forecasts".
Financial markets are all based on perception. Do people think a company is doing well? Do people think the economy will improve? Reality will eventually come to pass, but in the meantime people are setting contracts based on what they think the future will be (the forecasts)... and then another set of people try to make money by trying to anticipate what others think the future will be (the forecasts of the forecasts).
For example, companies on the stock market issue statements several times a year about how much money they made. Stock prices rise and fall based on these announcements. What if you knew before anyone else what an announcement was going to say? You could make a ton of money. You could buy low and sell high. Or sell before the price crashed. Obviously, if you're the person making the announcements, it would be unethical to make secret trades yourself before others knew what was happening. That is called "insider trading".
Similarly, the government issues an official forecast of this coming summer's runoff. Higher forecasts mean that there will be more water available for hydropower. That forecast is based on how much snow is building up (or not building up) in the mountains. If there is a dry month, the forecasts will likely drop. If the forecasts are issued only once a month, someone that could know the forecasts a couple days in advance could start trading away and make money before the others got wise.
There is a somewhat famous example of a visitor to a government forecasting office picking a draft out of a trash can before the official product was released. They ran off to the markets, made trades, made a killing, but then got caught because it was a suspicious trading pattern. Now those forecasters go in a sealed room so there is no leaking out of the information. Instead, private companies try to run the same tools that the government does, so they can anticipate what the official forecasts will be.
 |
| Here is the sign over the door of the forecasting room |
Thursday, January 19, 2012
The Climate Monitoring Network is Full of Holes
While consolidating some old hard drives I found this picture from when I was doing fieldwork in Utah.
This was what was called a "decoy raingage". Like most other raingages out there, rain falls in the central tube and collects at the bottom. The vertical metal strips all around it are the wind shield. Without the wind shield, light fluffy things like snow would fall into the gauge and then blow back out. The strips calm the wind around the opening at the top, so the snow can just fall straight in. Without the strips, you would underestimate the amount of precipitation that had actually fallen, which is a bad thing.

The downside is that these stripes make great targets for shooting practice. Someone with a gun and good aim could send them whizzing around like a carnival game. It is the same with shiny solar panels. As you can see, this gauge has about 11 bullet holes. This gauge now probably underestimates, but for a different reason.
When I was a forecaster, I could always tell when hunting season started in the woods. Data collection spots, as dots on my computer screen, would flicker out with a silent scream as they were hunted down one by one.
Vandalism is has been a serious issue for as long as anyone can remember and people have tried many ways to deter it. I mentioned earlier that this was a decoy site. It is not hooked into anything. The real measurement site is hidden in the woods in the background. This one is just so people can get their shooting fix in.
Putting a large sign "Property of the US Federal Government" only seems to invite more harm. What did someone tell me was the most effective? Using a sign with a large American flag instead. Nobody messes with "Ol' Glory."
Tuesday, January 17, 2012
Hydrologic Oddities: The Biggest Dam You'll Never See
While looking for strange rivers, I've come across many that run underground (see posts about the Underground River in the Philippines, in Wyoming, and so on). Are there also underground lakes? There are lakes in caves, but more commonly people get groundwater from aquifers below the water table. But what about underground reservoirs?
Strangely enough, there are several underground artificial lakes on the small island of Miyakojima, Japan. The limestone rocks are highly permeable (i.e. water flows quickly through them) and they have a basement of mudstone, through which nearly no water can pass.
 |
| Concept of the underground dam. On the top is the cross section of the island without the artificial dam. How the water table is changed by the dam is shown on the bottom. |
In 1993 the Japanese built artificial walls that go down to the bedrock and hold back the groundwater flow. The underground walls at Sunagawa and Fukuzato hold back 20 million cubic meters of water, about 7 times the volume of the lakes in New York City's Central Park. There are two main dams, one of which is 50 meters (nearly 165 feet) tall. Wells dip into the underground lake to pull water to the surface for irrigation and other uses.
 |
| A spot where the lip of the underground dam is visible from the surface. The lip of the dam is to the right of the walkway. |
 |
| Overview of the island, how groundwater flows (lines), where it naturally comes to the surface (dots) and where the underground barriers were built (heavy black lines). |
 |
| The above-ground museum for the underground dams |
Other underground reservoirs exist, some dating back to the 1800s (but these are usually hollow tanks and are not built to hold back the actual water table). The ones in Japan might not even be the last, either- a proposed reservoir under Beijing is nearly 250 times the volume of Sunagawa and Fukuzato put together.
Saturday, January 14, 2012
The Pit in the Stomach Feeling
I thought this description of the emotional challenge of forecasting was good. It came from a story of the forecasters that tracked tornadoes causing nearly unprecedented damages across the US this year. This included the highest number of tornado fatalities since official records began. Joplin, the town mentioned, had 20 minutes warning of the impending disaster.

Original caption: In this April 26 photo, Mark Darrow, a meteorologist at the National Weather Service's Storm Prediction Center, talks with a colleague as he sits at his desk in the center in Norman, Okla. Despite knowing for days that tornadoes are coming, there's a certain helplessness that hits weather forecasters when funnels descend and a "pit of the stomach" feeling when the death toll rises.
It's the moments immediately after the storm appears on the radar — when damage reports and fatalities begin trickling in — that are difficult for the local National Weather Service offices, Andy Boxell, a meteorologist with the National Weather Service in Springfield, which covers Joplin.
His office was receiving damage reports within five minutes of the Joplin tornado touching down, he says.
"It's one of those things where there is undoubtedly that pit in the stomach feeling," Boxell says. "At the same time, the storm is still ongoing, and so while it's really, really hard to hear about everything, we almost have to disconnect for a moment and focus on the science and radar."
Boxell says it's later — usually a day or two after, when assessing the tornado's damage — that the magnitude of the devastation sets in for many.
"It's surreal in some cases. It was without a doubt the hardest on those who did the initial surveys the first day," he said.
Friday, January 13, 2012
2011: a "Mind-Boggling" Year of Natural Disasters
 |
| Flood damage from Hurricane Irene in New Jersey, August 2011 |
There is a well done 10 minute news segment on PBS about 2011 and its natural disasters. There is a transcript of the show here and here's a copy of the video:
See more from PBS NewsHour.
In the video, Jeff Masters has a useful analogy about climate change and weather being like a baseball player on steroids. You can't say that any specific home run was hit or not hit because someone was on "the juice". However, when previous records are being broken by a large margin, you can start to suspect foul play. The US typically sees 3 billion dollar disasters per year and the previous record was 9. 2011 saw 12 disasters (see a slideshow).
Masters also made connections between drought, food prices and political unrest. Most of what I've talked about so far has been on flooding and flood forecasting, but when you look at the bottom line, drought is more expensive than floods. It is hard for drought to capture the public attention, though, because it is a creeping disaster.
Here's a sample of some of the story's descriptions of floods, droughts and tornadoes:
HARI SREENIVASAN: Then, in late May, a tornado with winds topping 200 miles an hour leveled the town of Joplin, Mo. It was the single deadliest U.S. tornado since 1947, killing nearly 160 people.
MAN: I actually was planning on helping where it was really torn up, but there's nothing really to help. It's just flattened. There's -- I don't know. There's probably three-quarters-of-a-mile of nothing.
HARI SREENIVASAN: That same storm system brought triple the normal amount of rainfall to the Ohio River Valley. The rain, coupled with snowmelt, caused both the Mississippi and Missouri Rivers to flood. In August, Hurricane Irene drenched the Eastern Seaboard. It triggered record flooding in New Jersey, New York State and Vermont, and cost more than $7 billion.
WOMAN: Once the water started coming through the front door. I mean I knew things were getting bad. And then the walls started to break and the molding started to pop, and I knew I was really in trouble.
HARI SREENIVASAN: The Southern Plains and Southwest could only hope for some of that rain. Texas suffered through its worst one-year drought, as losses reached $10 billion in crops, livestock and timber.
Thursday, January 12, 2012
Hydrologic Oddities: Dismal Creek Nebraska. Predictable.
What's strange about this picture?
It is a time series of monthly flow in the Dismal River near Thedford, Nebraska in the US. On the left side is 1965 and it goes all the way through 2011, nearly 50 years. Let's compare it to 50 years of flow from another streamgage:
The Dismal River, however, is different in that it has nearly no cycle or variability. Rain or shine, summer or winter, Tuesday or Saturday, the flow is nearly always around 225 cubic feet/6.4 cubic meters per second. It's a healthy amount of flow, certainly not a trickle, but it is just relentless.
The river runs through the grassy Sand Hills of Nebraska and is fed by the Ogallala Aquifer. It is nearly entirely groundwater outflow and there is little water coming from recent rainfall. The gauge is relatively famous and is part of many benchmark monitoring networks because of how steady it is.
In some places the springs are coming up so fast that people can dive into the river and it pops them back up, even though these "boiling" springs are over 40 meters deep. Trying to float around in the spring is supposedly like "swimming in oatmeal".
If today's rainfall doesn't influence the runoff, then what does? To some extent, atmospheric pressure! When the air pressure is low, more water comes out of the ground.
Why is the river going up since the 1980s? I asked USGS hydrologist Ron Zelt and he noticed precipitation in the area has gone up about 11% and snow has gone up 15% between 1960 and 2000. He felt the rise is partly caused by the sometimes lengthy (e.g., decades long) periods when warmer (or cooler) sea-surface temperatures in the North Pacific Ocean contribute to differences in air pressure and atmospheric circulation patterns. This affects the weather in central Nebraska, and the signal is even greater in the North and West. Well levels were rising relatively rapidly from the 1980s until the start of the 2000s.
Then, about a decade ago (i.e., in 1999), a long period with a generally warmer-than-average North Pacific Ocean ended, and with it, a period of increased rain and snowfall in Nebraska gave way to drought during 2000-06. There is about a ~9 year lag as the rainfall works its way through the soils from the surface to about 100 feet down. It is these lower levels that feed the Dismal River's flow. Since the rainfall has not been what it used to be since 2000, well levels have done a U-turn and started to drop. 2002 was the second driest year in the last 50 and other years were almost as poor. Depending on what the rainfall does in the future, it might be a few years before the river, as well, eventually starts drifting down again to more dismal levels.
 |
| Monthly streamflow of the Dismal River (data from the USGS) |

|
| Monthly streamflow for the Animas River (again from the USGS) |
Like breath flowing in and out, or blood coursing through a vein, most rivers have some sort of regular cycle of up and down. In the case of the second chart (the Animas River) it is the springtime snowmelt that causes the repeating pattern. Even snow-free rivers have cycles, perhaps because of a summer monsoon or a rainy season. Even if the rainfall is the same every month, higher evaporation in the summer versus winter can cause seasonal cycles. In places without strong cycles, there's still usually some sense of variability, perhaps because one year was wetter than another.
The Dismal River, however, is different in that it has nearly no cycle or variability. Rain or shine, summer or winter, Tuesday or Saturday, the flow is nearly always around 225 cubic feet/6.4 cubic meters per second. It's a healthy amount of flow, certainly not a trickle, but it is just relentless.
 |
| The River tries not to take its name personally. The steep far bank shows where the grass is stripped away and the ground underneath is very sandy. |
 |
| The Dismal River Streamgage in 2012 (photo courtesy of USGS Nebraska Water Science Center) |
If today's rainfall doesn't influence the runoff, then what does? To some extent, atmospheric pressure! When the air pressure is low, more water comes out of the ground.
 |
| Manually measuring streamflow (photo courtesy of USGS Nebraska Water Science Center) |
Why is the river going up since the 1980s? I asked USGS hydrologist Ron Zelt and he noticed precipitation in the area has gone up about 11% and snow has gone up 15% between 1960 and 2000. He felt the rise is partly caused by the sometimes lengthy (e.g., decades long) periods when warmer (or cooler) sea-surface temperatures in the North Pacific Ocean contribute to differences in air pressure and atmospheric circulation patterns. This affects the weather in central Nebraska, and the signal is even greater in the North and West. Well levels were rising relatively rapidly from the 1980s until the start of the 2000s.
Then, about a decade ago (i.e., in 1999), a long period with a generally warmer-than-average North Pacific Ocean ended, and with it, a period of increased rain and snowfall in Nebraska gave way to drought during 2000-06. There is about a ~9 year lag as the rainfall works its way through the soils from the surface to about 100 feet down. It is these lower levels that feed the Dismal River's flow. Since the rainfall has not been what it used to be since 2000, well levels have done a U-turn and started to drop. 2002 was the second driest year in the last 50 and other years were almost as poor. Depending on what the rainfall does in the future, it might be a few years before the river, as well, eventually starts drifting down again to more dismal levels.
 |
| Dried out grasslands in 2002 (photo courtesy of USGS Nebraska Water Science Center) |
In the rest of this blog, I've tried to highlight a few "hydrologic oddities" (follow the link to the "best of" page for a running list). These are unique, strange, weird rivers that just don't fit the standard "leaky bucket model" of how hydrologists think watersheds should behave. It is important to remember that the extremes include rivers that are un-predictable but some that are also unusually predictable, such as the Dismal.
In that spirit, here's a trivia question - when it comes to months-ahead river forecasting (like the kind highlighted here), what part of the Western US do you think is the most predictable, i.e. where are the forecasts are the most accurate? If you think you have an idea, leave a comment below...
Tuesday, January 10, 2012
Streamchasers - Chasing Gauges in New England
The Discovery Channel has a TV show "Storm Chasers" that describes the real-life adventures of meteorologists chasing tornadoes. They drive in heavily armored vehicles with weather sensors on them and try to get in the path of storms. One team is making an IMAX/3D film, others are making videos and collecting meteorological data.
The show has drama, danger, frustration and excitement. Oftentimes the forecasts are a bust, the teams get lost, the storms fall apart, or just nothing seems to work right. Occasionally, though, they get to experience the full fury of nature and live to tell about it. But why should weathermen have all the fun risking their lives in the name of science? Here, written in the style of a Storm Chasers episode, is the story of our adventures in spotting streamgages on our way to an interview for my book.
TOM: "2011 was a wild year for central New England. In June a massive tornado literally sucked the Connecticut River into the air. Then Hurricane Irene in August caused flooding all up and down the East Coast, destroying dozens of houses here. There was a killer cold blast in November; unprecedented snows buried everything and knocked out power to more than three million people. When that snow melted, the streams went buck wild."
TOM: "But disasters like these can be prevented. If hydrologists have the right data, they can warn people to get out of harm's way. Hopefully some of the information that's being collected today will result in advances in the way that forecasters make predictions. At the end of the day, it could save lives."
ANNOUNCER: Today we're joining Team S.I.V. in their Stream Intercept Vehicle. Kitty will be piloting the chase vehicle, guided by hydrologist Tom Pagano. These extreme flood chasers will be stalking streamgages in the central Connecticut region, north of New Haven.
KITTY: "I'm a little nervous about today. A couple weeks ago we were stream chasing in the open plains of Colorado. There, you can see the rivers in the valleys from miles away. Here in the closed in woodsy areas of New England- you have nearly no warning. You'll be barreling down the road and cross a bridge and all of a sudden there's some babbling brook and it's too late to stop. You could slam on the brakes but it might cause a pile-up. The last time I did that Tom got coffee all over himself. Stream chasing today could be very very dangerous."
TOM: "The S.I.V. is outfitted with the latest in stream monitoring technology. We have Google Earth hooked up to the Internet through our mobile phone. We downloaded the metadata layers from the USGS that show us where all their realtime measuring sites are [click the link to get your own copy. Here's also non-realtime sites]. They are color coded by how high the streamflows are this very moment. You can click on the sites and download the current water levels. We're going to see if we can use this information to locate streamgages and drive right up to them. We're going to see how close we can get without hurting ourselves."
KITTY: "Let's go where ever you think we have the best chance for deployment..."
TOM: "I'm not sure that we're going to see any flooding today but this area of dark blue dots is going to be our best shot at finding some high water. The darker the dots, the more extreme conditions we're expecting to encounter.
KITTY: "We never know what will happen though. In this job, the day could have anything in store for us. It's all a combination of information, technology, instinct and luck.... So where are we headed today?"
TOM: "First stop is Wallingford Connecticut. This is a real important and historic site. It was installed in 1930 and has barely missed a day of measurements in 80 years. Since it's been around for so long and the watershed above it hasn't changed much, it is part of an elite set of stations used widely for scientific research called the Hydro-Climatic Data Network. This site is also upstream of New Haven, a city of about 850 thousand people... Ok, to get there we need to get off Highway 91 and onto some of these surface streets. Go left here..."
KITTY: "I don't think this is right." [Drives straight at the traffic light]
TOM: "Kitty, go left! Go left! Gah... We're totally lost, this is a complete disaster! This is not good."
ANNOUNCER: Frustrated, team S.I.V.'s morale is dropping as they are forced to make a U-Turn in the warehouse district. Then suddenly, Wallace Dam comes into view.
KITTY: "New England is full of small old dams. This eight foot dam is the last barrier to fish passage on the Quinnipiac River. A fishway is being built so the fish can swim around the dam. These white bags on the left are called a "coffer dam" and they hold back the river flow while they do the construction to build the fish passage."
[The team continues to drive, checking the GPS]
TOM: "There's gotta be a streamgage around here somewhere. According to the map, this gage could be anywhere around us... We should be right on top of it!"
KITTY: "There! Across the highway! In the woods!"
TOM: "We have streamgage, I repeat, we have streamgage. Get ready to intercept."
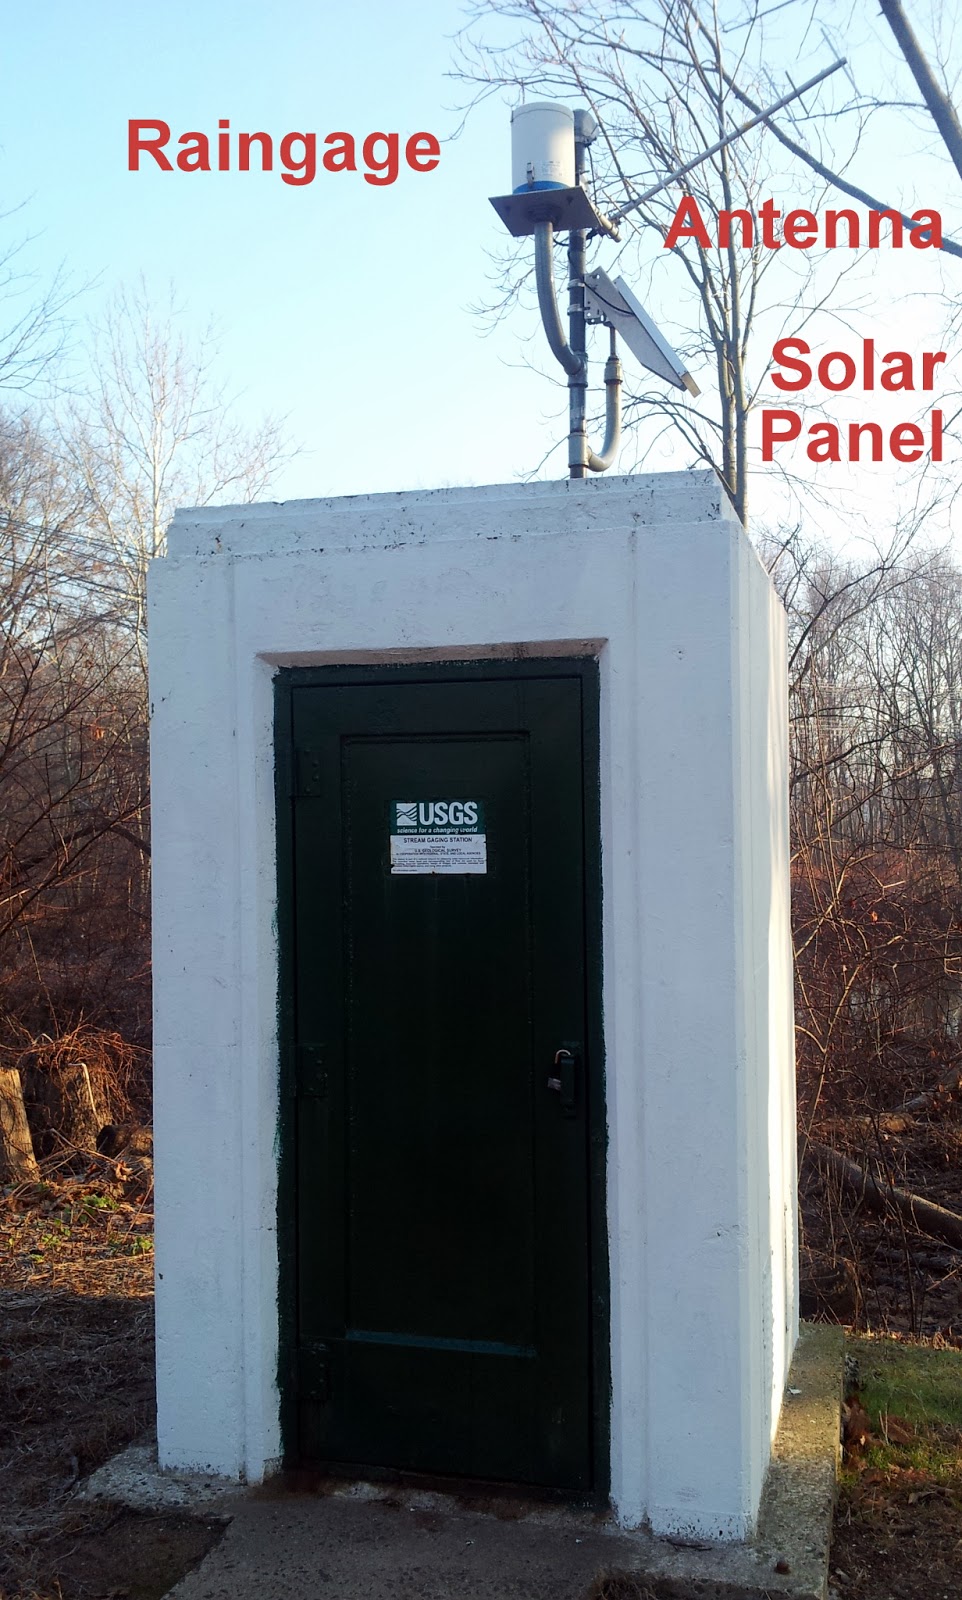
TOM: "This site has sensors that measure the height of the river and send the information to that white building. On top of the building, it is also equipped with a raingage. The solar panel is to power the site and the antenna is to transmit the data back to the USGS. The USGS then makes that available to anyone, including river forecasters and emergency managers. All the data for all of the country is available, and is free of charge."
KITTY: "The river is looking pretty tame right now, but I heard recently it has been acting up. Let's see if we can get some historic data."
ANNOUNCER: Connecting their laptop to their mobile phone, the Streamchasers can easily download any of the USGS data they want. Within a minute, they are able to see a full history of the station...
TOM: "We're getting data like crazy right now. This site is still measuring new data as we speak..."
KITTY: "Check out that peak in March!!! It was over the 10-year recurrence interval! The river must have been violent, very violent!"
 |
| Stormchasers logo (top). "The Dominator" (bottom) is one of the armored cars for driving into tornadoes. The Dominator has been called the "Big Red Shoe" because of its shape. |
 |
| When other people are driving away, in fear, the Storm Chasers drive on, in anticipation |
 |
| The chase vehicles are stocked to the gills with technology (multimedia and scientific). |
TOM: "2011 was a wild year for central New England. In June a massive tornado literally sucked the Connecticut River into the air. Then Hurricane Irene in August caused flooding all up and down the East Coast, destroying dozens of houses here. There was a killer cold blast in November; unprecedented snows buried everything and knocked out power to more than three million people. When that snow melted, the streams went buck wild."
TOM: "But disasters like these can be prevented. If hydrologists have the right data, they can warn people to get out of harm's way. Hopefully some of the information that's being collected today will result in advances in the way that forecasters make predictions. At the end of the day, it could save lives."
ANNOUNCER: Today we're joining Team S.I.V. in their Stream Intercept Vehicle. Kitty will be piloting the chase vehicle, guided by hydrologist Tom Pagano. These extreme flood chasers will be stalking streamgages in the central Connecticut region, north of New Haven.
 |
| Our Big Red Shoe: The S.I.V. Streamgage chasing vehicle is gassed up and ready to go. |
 |
| We've got our Dunkin' Donuts. Now let's roll! |
 |
| Tom's streamgage monitoring workstation in the S.I.V.'s cockpit. |
 |
| Head for the blue dots for the intercept. |
KITTY: "We never know what will happen though. In this job, the day could have anything in store for us. It's all a combination of information, technology, instinct and luck.... So where are we headed today?"
 |
| Target: Station 01196500 Quinnipiac River at Wallingford, CT |
TOM: "First stop is Wallingford Connecticut. This is a real important and historic site. It was installed in 1930 and has barely missed a day of measurements in 80 years. Since it's been around for so long and the watershed above it hasn't changed much, it is part of an elite set of stations used widely for scientific research called the Hydro-Climatic Data Network. This site is also upstream of New Haven, a city of about 850 thousand people... Ok, to get there we need to get off Highway 91 and onto some of these surface streets. Go left here..."
KITTY: "I don't think this is right." [Drives straight at the traffic light]
TOM: "Kitty, go left! Go left! Gah... We're totally lost, this is a complete disaster! This is not good."
ANNOUNCER: Frustrated, team S.I.V.'s morale is dropping as they are forced to make a U-Turn in the warehouse district. Then suddenly, Wallace Dam comes into view.
 |
| Coffer-dam (left) at Wallace Dam. |
[The team continues to drive, checking the GPS]
TOM: "There's gotta be a streamgage around here somewhere. According to the map, this gage could be anywhere around us... We should be right on top of it!"
KITTY: "There! Across the highway! In the woods!"
TOM: "We have streamgage, I repeat, we have streamgage. Get ready to intercept."
 |
| Streamgage (white building) in sight. |
 |
| We had to race along an embankment and across four lanes of highway traffic. The debris of litter from passing cars was flying everywhere. It was a very dangerous situation. |
 |
| Success! |
 |
| The instrument shed of the streamgage. For being a concrete closet, it still has a bit of a 1930s art-deco feel to it. |
TOM: "This site has sensors that measure the height of the river and send the information to that white building. On top of the building, it is also equipped with a raingage. The solar panel is to power the site and the antenna is to transmit the data back to the USGS. The USGS then makes that available to anyone, including river forecasters and emergency managers. All the data for all of the country is available, and is free of charge."
 |
| The automated measurements are verified against a "staff gage", a giant ruler that measures the river height. |
 |
| Wisps of fog come off the river surface. |
KITTY: "The river is looking pretty tame right now, but I heard recently it has been acting up. Let's see if we can get some historic data."
 |
| Screen shot of USGS entry page for data on our laptop |
 |
| ...from how the river has been flowing in the last week (the line) compared to what it typically is this time of year (the triangles)... |
 |
| ... to how it has been flowing in the last year. The green and red horizontal bars are when the river reached the danger level for flooding.... |
TOM: "And we just missed it by ten months..." [Beating his fists in frustration]
KITTY: "The 2011 Season was incredible; this area saw close to the highest water it has ever seen. Along the drive up we saw some storm and flood damage. People's lives and livelihoods were affected."
TOM: "But we're a long way from fully understanding how these streams behave. We need to get this data into the hands of forecasters and researchers. Communities need this information to make better decisions. We need to understand how this planet works and what's the best way for us to live on it."
KITTY: "I will say that 2012 is shaping up to be the strangest year ever. But in this business it always seems like next year is the strangest year ever. That's what I love about forecasting and streamchasing. You never know what's going to be around that next corner..."
 |
| It takes seconds to download a custom chart of what it has been doing over the last 80 years! |
TOM: "But we're a long way from fully understanding how these streams behave. We need to get this data into the hands of forecasters and researchers. Communities need this information to make better decisions. We need to understand how this planet works and what's the best way for us to live on it."
KITTY: "I will say that 2012 is shaping up to be the strangest year ever. But in this business it always seems like next year is the strangest year ever. That's what I love about forecasting and streamchasing. You never know what's going to be around that next corner..."
Subscribe to:
Posts (Atom)